
PLTR | Palantir Technologies
Palantir Technologies (NASDAQ: PLTR) may be approaching a significant turning point. After reaching a record high of $212.94 on 12 October, the stock suffered a sharp sell-off, falling 7.2% in a single session as selling pressure spread across AI-related equities. By 27 October, Palantir had closed at $198.73, remaining below a key technical level that we believe could determine its next major move.
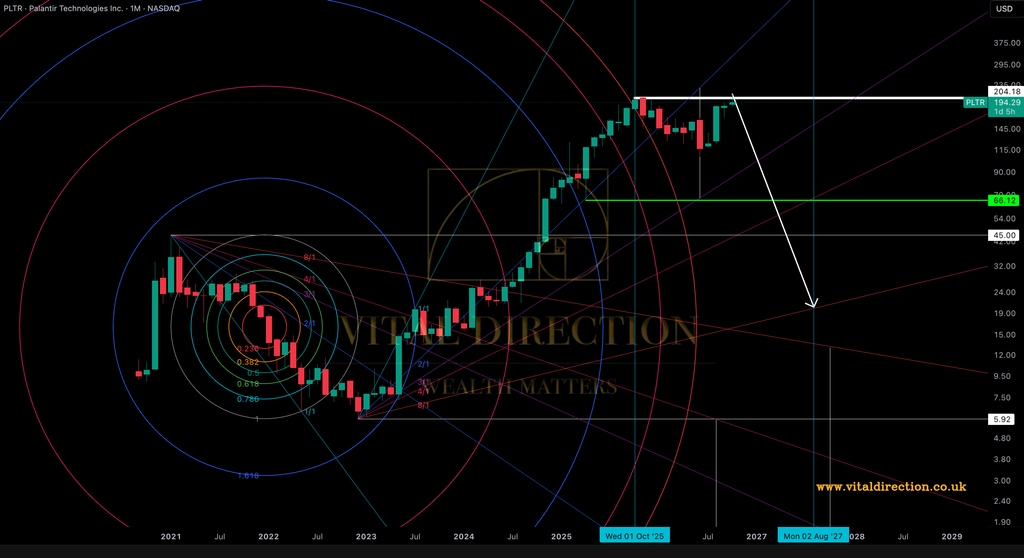
At Vital Direction, our technical analysis suggests that Palantir could be forming a major bearish reversal pattern, with a potential downside scenario exceeding 80% from its current valuation.
This outlook is based on four technical signals: an apparently completed Elliott Wave structure, two converging Gann time projections and a completed Fibonacci cycle. We will examine each signal, identify the critical price level that keeps our bearish scenario in focus and explain what could invalidate our analysis.
The Key Level: $204.18 on a Monthly Closing Basis
The $204.18 level is central to our bearish outlook.
As long as Palantir remains below $204.18 on a monthly closing basis, our bearish scenario remains in focus. Continued monthly closes beneath this level would reinforce our view that the stock could be vulnerable to a substantial correction.
Conversely, a sustained recovery above $204.18 would weaken the bearish case and require us to reassess the technical structure.
The immediate focus is October’s monthly close, followed by Palantir’s third-quarter earnings results, scheduled for 2 November. These two developments could provide important clues about the stock’s next direction.
Why Are We Bearish on Palantir Stock?
Our bearish outlook is supported by four technical observations. While none of these signals should be considered decisive in isolation, their convergence makes the current market structure particularly significant.
1. Elliott Wave Analysis: Has the Five-Wave Advance Completed?
Elliott Wave Theory suggests that major market trends typically develop through a five-wave impulsive structure, followed by a corrective phase in the opposite direction.
Our Elliott Wave count indicates that Palantir’s advance from its December 2022 low, near $6, may have completed all five impulsive waves.
Of particular interest is the final leg of the advance. Price moved only 2.6% above the November 2025 peak of $207.52 before reversing. This relatively limited extension could indicate weakening bullish momentum and a mature upward cycle.
Should this interpretation prove correct, Palantir may now be entering a larger corrective phase rather than continuing its previous upward trajectory.
2. Gann Time Cluster #1: December 2022 Low to July 2023 High
W.D. Gann’s market analysis placed considerable emphasis on the relationship between price and time, suggesting that significant market turning points can emerge when important time cycles converge.
Our first Gann time projection uses the interval between Palantir’s December 2022 low and its July 2023 high.
Projecting this time interval forward identifies a potential turning-point window around the current period. This makes the present market structure particularly important, especially given the signs of exhaustion emerging from our Elliott Wave analysis.
3. Gann Time Cluster #2: January 2021 High to May 2022 Low
Our second Gann time projection is based on a separate historical market cycle, using Palantir’s January 2021 high of approximately $45 and its May 2022 low as reference points.
This independent calculation identifies another potential turning-point window around the same period.
The significance lies in the convergence of the two projections. When separate historical time intervals identify a similar potential turning point, we consider the resulting time window more noteworthy.
Combined with the apparent completion of the five-wave advance, this convergence adds weight to our bearish scenario.
4. Fibonacci Cycle Completion: Has the Market Cycle Run Its Course?
Our final technical observation comes from Fibonacci cycle analysis.
Using the January 2021 high and December 2022 low as our reference points, our analysis suggests that a complete Fibonacci circle has now been formed.
From a cyclical perspective, this could indicate that the market rhythm established during the 2021–2022 bear market has reached an important point of completion.
While Fibonacci cycles cannot independently establish a market top, their alignment with the Elliott Wave count and Gann time projections strengthens the case for monitoring the current period closely.
The Technical Confluence
The combination of these four observations is what makes Palantir particularly interesting from a technical perspective.
We are looking at:
- A potentially completed five-wave Elliott Wave advance.
- Two independent Gann time projections converging around the current period.
- A completed Fibonacci cycle.
- Price struggling to sustain its position above the previous record high.
Individually, these tools provide different perspectives on market behaviour. Together, however, they present a technical structure that warrants close attention.
The Bigger Picture: Is the AI Market Approaching a Bubble?
Our concerns extend beyond Palantir’s individual technical structure.
We believe the broader artificial intelligence (AI) sector could be vulnerable to a significant correction. The rapid expansion of AI-related valuations, substantial infrastructure spending and growing reliance on debt financing have raised questions about the sustainability of the current investment cycle.
In mid-October, concerns surrounding debt-funded AI infrastructure contributed to a difficult period for technology shares, with the Nasdaq recording its worst weekly performance since June. Furthermore, the IMF’s October 2026 Global Financial Stability Report identified a correction in AI-linked equities as one of three significant risks to global financial stability.
Palantir is among the most richly valued companies associated with the AI investment theme, trading at nearly 60 times its revenue guidance for the year, according to the figures referenced in our analysis.
Historically, highly valued growth stocks can be particularly vulnerable when market sentiment deteriorates. Palantir itself provides a notable example: between January 2021 and December 2022, the stock lost approximately 87% of its value.
This historical decline does not guarantee a repeat of the same performance. However, it demonstrates the potential scale of downside risk when valuations, investor expectations and market sentiment move sharply in the opposite direction.
If the broader AI trade begins to unwind, Palantir could face additional pressure, particularly given its premium valuation.
What Would Invalidate Our Bearish Palantir Forecast?
No technical analysis is complete without identifying the conditions that would challenge its underlying thesis.
For our bearish scenario, the most important level remains $204.18 on a monthly closing basis.
A sustained monthly close above this threshold would weaken our bearish outlook and suggest that Palantir’s upward trend may still have room to extend.
The company’s third-quarter earnings results, scheduled for 2 November, could also influence market sentiment. Palantir has exceeded revenue expectations in each of its previous seven quarters, according to the figures referenced in our analysis. Another strong performance could provide the catalyst for a renewed bullish move.
Should price establish a sustained position above the critical level, our Elliott Wave count would need to be reassessed accordingly.
Our approach is straightforward: the technical structure must be confirmed by price action. We will not treat a bearish forecast as valid simply because several indicators appear to align.
Palantir Stock Forecast: Our Final Outlook
Palantir may be approaching a major cyclical turning point.
Our analysis identifies a potentially completed five-wave Elliott Wave advance, two converging Gann time projections and a completed Fibonacci cycle. These technical signals are emerging as the stock struggles to maintain its position above its previous record high.
At the same time, growing concerns surrounding AI valuations, infrastructure financing and broader market sustainability provide an additional reason to monitor the risk of a substantial correction.
We believe the possibility of a major bearish reversal should not be overlooked. Our downside scenario exceeds 80%, although this remains a projection rather than a guaranteed outcome.
For now, $204.18 remains the level to watch on a monthly closing basis. Sustained trading below this threshold keeps our bearish scenario in focus, whereas a decisive recovery above it would weaken the thesis.
At Vital Direction, we will continue monitoring Palantir’s price action, market structure and cyclical projections to assess whether the anticipated reversal is beginning to unfold.
Follow Vital Direction for professional technical analysis, Gann and Elliott Wave forecasts and market insights across global financial markets.
Disclaimer: This article is provided for educational and informational purposes only. The analysis represents the views of Vital Direction and should not be considered investment advice or a recommendation to buy or sell any financial instrument. Technical projections are scenarios, not certainties. Financial markets involve substantial risk, and individuals should conduct their own research before making investment decisions.
Discover more from Vital Direction
Subscribe to get the latest posts sent to your email.