Understanding the VIX Index: A Comprehensive Analysis for Market Predictions
The VIX index, often referred to as the “fear gauge” of the financial markets, provides crucial insights into market volatility. Since its inception, the VIX has been a valuable tool for investors and analysts seeking to gauge market sentiment and potential turning points.
Historical Overview and Elliott Wave Analysis
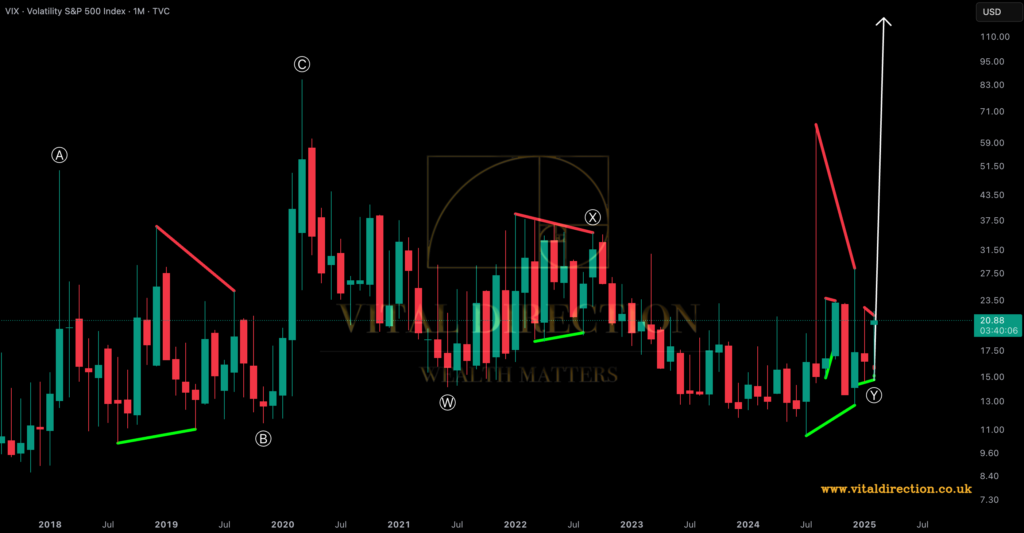
Our analysis traces back to the market bottom around November 2017, where the VIX index embarked on an upward trajectory in a three-wave pattern, identified as an ABC structure. The wave B was characterised by a triangle formation, and the concluding wave C terminated around the $85 mark. Following this, the VIX entered a corrective phase, forming a W-X-Y pattern. In this structure, wave W was a zigzag, wave X formed a triangle, and wave Y concluded around the 14.47 level.
Potential Bullish Signal and Market Implications
Looking ahead, we anticipate that a breach of the 22.51 level could trigger a bullish signal for the VIX, potentially driving it towards the $100 target by late March 2025. This projection suggests that the S&P 500 may experience further declines until this timeframe.
Seasonality and Confirmation of Analysis
Supporting our analysis is the seasonal pattern of the VIX, indicating a market bottom around mid-February and a peak in mid to late March. This seasonal behaviour aligns perfectly with our Elliott Wave Theory, Gann analysis, and Fibonacci projections, reinforcing our forecast of a significant market movement.
Stay tuned to Vital Direction for more in-depth analyses and insights to navigate the financial markets effectively.

Join Vital Direction to stay updated with our comprehensive market analyses and insights as we navigate these exciting developments in the financial markets.
Discover more from Vital Direction
Subscribe to get the latest posts sent to your email.
